Introduction
We are committed to playing our part to tackle emissions that are contributing to climate change and therefore we produce a report every year outlining the greenhouse gas (GHG) emissions that are produced by its own operations. The report uses a greenhouse gas accounting tool and includes scope 1,2 and some scope 3 emissions to assess data for the financial year 2023/24.
We started measuring our GHG emissions in 2008/09 and therefore this is used as the base year for comparisons. Further comparisons are also made to the previous year 2022/23. The data is analysed to show the different sources of emissions and evaluates progress against our goal of being carbon neutral by 2038. There is particular focus on our electricity and gas consumption as these are where most of the emissions are coming from. The report also provides an overview of our recent progress towards carbon reduction.
Producing this report is an important exercise for us. It enables us to understand our own emissions and identify areas where more progress is required. It also helps us to be transparent and demonstrate how our operations are contributing to GHG emissions.
How we measure carbon emissions
Accounting tool and emission factors
To collate the data for this report we used Local Partnerships ‘Greenhouse Gas Accounting Tool. This tool uses the latest version of greenhouse gas conversion factors released by the Government.
What areas of activity are included?
We have attempted to include all areas of our operation, including council operated buildings such as council offices, schools, community, and leisure centres; council-related travel, streetlighting and homeworking.
Base year
The base year is 2008/09.
Targets
Bury Council has declared a Climate Emergency and set a target for the borough to be carbon neutral by 2038. This includes all emissions associated with the operation of the council that are recorded in this report. We need to reduce our GHG emissions to zero by 2038 to achieve this target.
We have produced a Climate Strategy and Action plan that aims to outline how we will achieve our boroughwide target for 2038.
Types of emissions data
The Government has identified 3 types of emissions described as follows:
- Scope 1 - Emissions from activities that are owned or controlled by the council and are released straight into the atmosphere, for example, from council owned boilers and vehicles.
- Scope 2 - Emissions released due to using electricity.
- Scope 3 - Emissions from equipment or vehicles that do not belong to the council but are used to deliver council functions, for example, officers using their own cars for council business. It also includes the estimation for homeworking.
Our approach
We aim to collect and include as much data as possible in this report. Below outlines what data we include for each scope.
Scope 1
This report includes all Scope 1 emissions except for fugitive emissions. Fugitive emissions are uncontrolled emissions from air conditioning and refrigeration units. It was felt that this information would be difficult to collect accurately and would represent a small percentage of the council’s total Scope 1 emissions.
Scope 2
All Scope 2 emissions have been included.
Scope 3
For Scope 3 emissions, the following have been included:
- Business mileage in private cars
- Outsourced travel relating to car parking enforcement.
- Business travel on planes, trains, and other public transport
- Losses in transmission of electricity (Government guidance advises that these emissions should appear in Scope 3)
- Home working
Bury Council’s Greenhouse Gas Reporting 2008/9 to 2023/24
| Emission | Base year 2008/09 | Last year 2022/23 | This year 2023/24 |
|---|---|---|---|
| Gas consumption (Scope 1) | 11313 | 4133 | 3636 |
| Owned equipment (Scope 1) | 255 | 16 | 0* |
| Owned transport (Scope 1) | 1499 | 1163 | 1377 |
| Total Scope 1 | 13067 | 5312 | 5013 |
| Purchased electricity (Scope 2) | 14560 | 3189 | 3158 |
| Total Scope 2 | 14560 | 3189 | 3158 |
| Business car travel (Scope 3) | 570 | 368 | 150 |
| Business rail travel (Scope 3) | 18 | 1 | 0.2 |
| Business air travel (Scope 3) | 10 | 1 | 5 |
| Electricity transmission and distribution losses (Scope 3) | 1132 | 292 | 273 |
| Homeworking (Scope 3) | n/a | 121 | 152 |
| Total Scope 3 | 1730 | 783 | 580 |
| Grand Total (Scope 1 to 3) | 29357 | 9284 | 8753 |
| Intensity measurement (t of CO2e per £m revenue expenditure) |
186 | 51 | 41 |
*We no longer use gas oil for our equipment and therefore this will be included in our overall consumption for vehicles overall.
Carbon emission sources
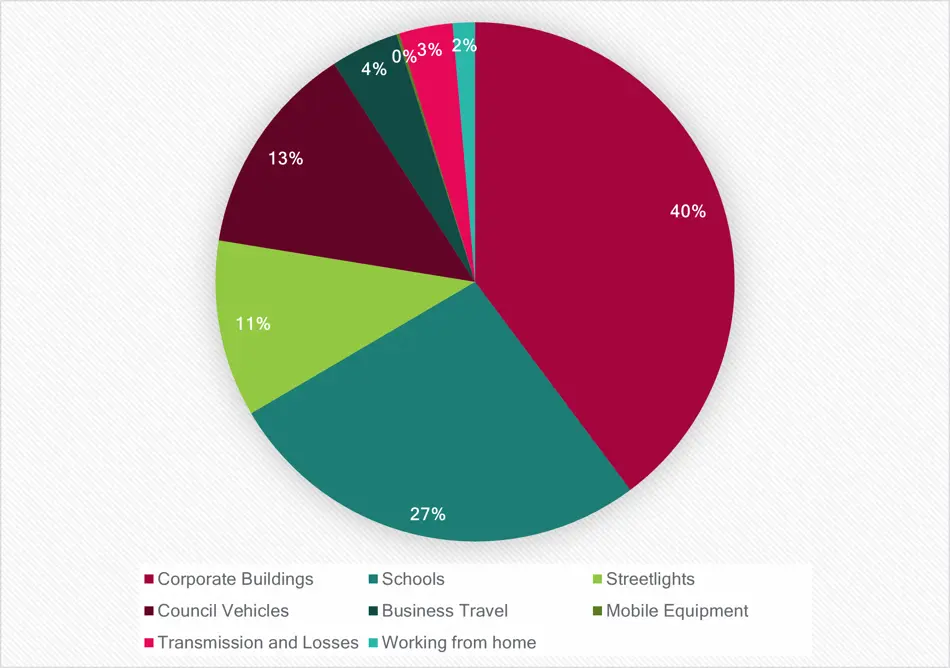
Council emission sources:
- Corporate buildings: 40%
- Schools: 27%
- Streetlights: 11%
- Council vehicles: 13%
- Business travel: 4%
- Mobile equipment: 0%
- Transmission and losses: 3%
- Working from home 2%
This information demonstrates where the council’s carbon emissions are coming from. It is clear to see that most of the emissions are coming from corporate buildings and schools, which makes up 67% of the total. The other significant sources are streetlights (11%) and transport (council vehicles 13% and business travel 4%).
Greenhouse gas emissions 2008/2009 to 2023/2024
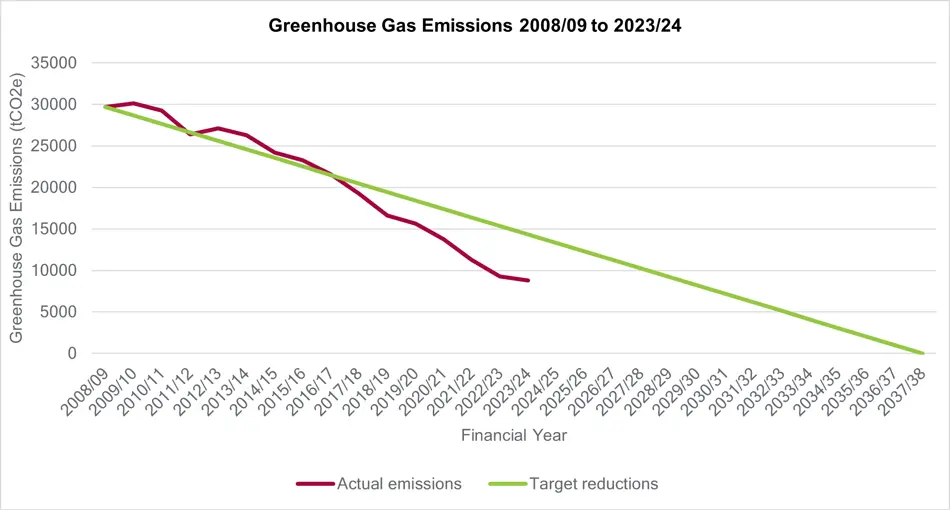
Progress on carbon reduction
The data and graphs show the progress we have made on reducing our emissions year on year since the base year of 2008/09. Looking at the two trend lines the graph suggests that we are ahead of schedule to achieve our target of being carbon neutral by 2038. However, the target reduction line is based on a quite simple estimation of reducing emissions at a steady rate until 2038. The reality of achieving this is not that simple, there will be emissions that will be difficult to eliminate and therefore progress could stall in the future. It is also important to note that our emissions have reduced significantly since the base year due to a reduction in the size of our operations including the academisation of schools, which has removed the emissions of those schools out of scope.
We have made progress in reducing our emissions from our current operations as mentioned in previous reports by upgrading its fleet of vehicles for more efficient vehicles including 15 electric vans, introducing solar panels to a number of buildings, and improving the energy efficiency of its buildings through using Public Sector Decarbonisation Scheme funding. The continued decarbonisation of the national electricity grid is another significant contributor to our falling emissions.
To continue with our current trend of reducing emissions faster than required, we need to make significant progress on tackling the areas where emissions remain consistent. This includes moving away from fossil-fuel based heating systems, i.e., gas boilers, improving the energy efficiency of our buildings and decarbonising our fleet.
Electricity and gas use
Gas and electricity use make up over 80% of our emissions.
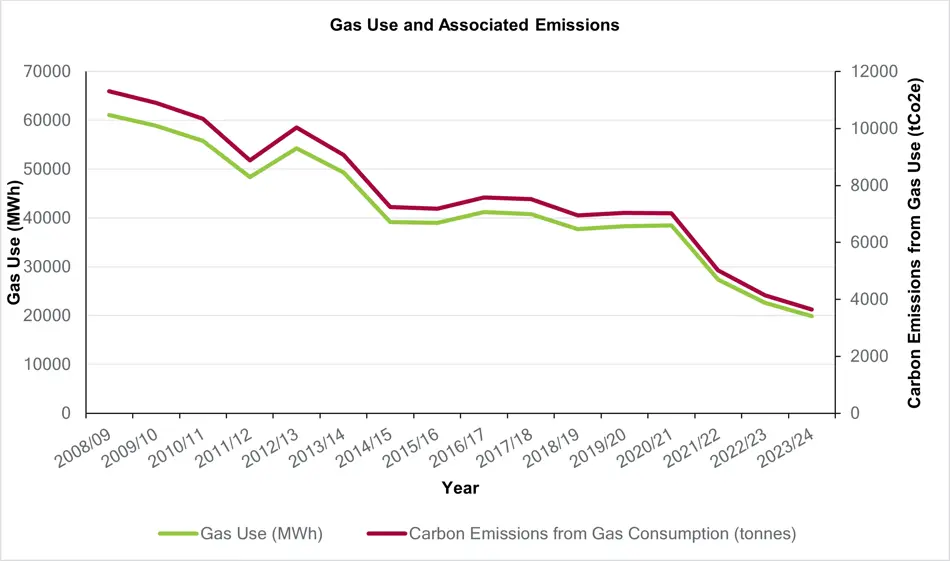
The graph shows emissions from gas use represent 41.3% of our total GHG emissions and these have decreased 68% from the 2008/09 base year.
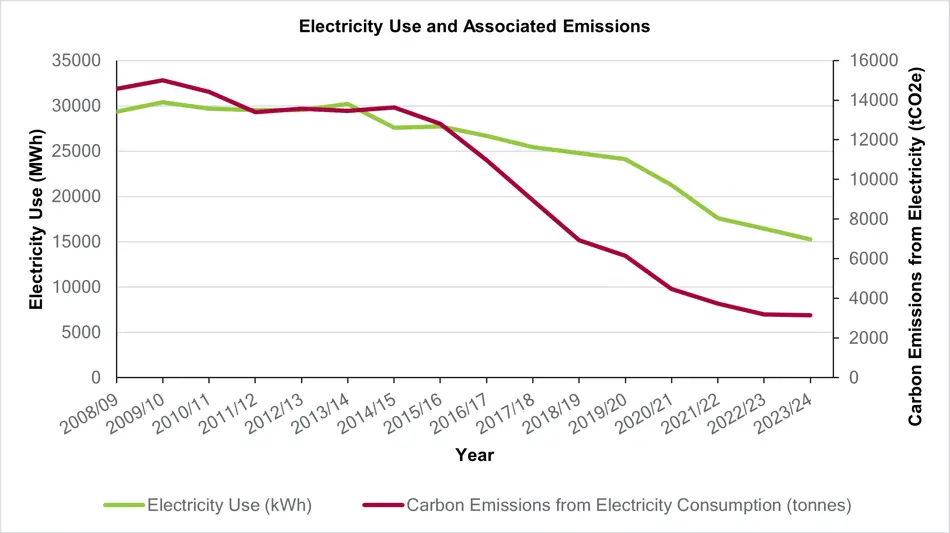
The graph shows emissions from electricity represent 36% of our emissions and have decreased 52% since the base year. However, due to the decarbonisation of the grid there has been a much larger reduction in GHG emissions, which is demonstrated by the gap between the two lines on the graph above.
The graph also shows that greenhouse gas emissions from electricity use have reduced by 78% since the base year.
Council vehicles
Emissions from the council vehicle fleet makes up 13% of the total emissions and is the third largest contribution after council buildings and schools. There has been an increase in the number of emissions since 2022/23 of 18%, although there is still an 8% reduction from the base year. It is not clear why emissions are so much larger than last year. This is something that requires further investigation. As the fleet has recently been updated, work needs to be done to look at how we will transition to zero emission vehicles in the future, which will be necessary to achieve our 2038 carbon neutral target.
Business travel
There have been significant reductions in personal car use for council business in the last year, with a 59% reduction from last year and a 74% reduction from the base year. This is most likely due to the council changing its rules about claiming mileage, which has removed the requirement to reach 2000 miles to be classed as a priority car user, as well as tighter spending rules in general. There has also been a reduction in rail use, which has likely been influenced by the same spending restrictions. This is the first year that bus and tram travel has been included in these figures. We need to continue to improve how this data is collected but currently it is having an insignificant impact on our overall emissions.
There is a risk with this data that due to the spending restrictions, council staff have still been making these journeys but not claiming the expenses, which is how the data is captured. This would then give a figure that is falsely lower than it should be.
Lastly included in here is air travel, which is very uncommon and therefore has a very minor impact on our emissions.
Homeworking
We have included homeworking in our calculations again this year. As with last year, this is a crude estimation. To estimate the number of Full Time Equivalent (FTE) hours working from home we use the total FTE classed as agile workers (which means they are not front line or assigned to a location). We then assume they spend half their week at home in line with current procedures and multiply this by the number of working weeks. This number is then entered into the tool. Emissions from home working make up a minor part of the emissions overall.
Bury Council’s carbon management activity update
Climate Action team and Climate Action Strategy
- We have released our Climate Action Plan update, which gives an overview of the progress it has made towards its target of being carbon neutral by 2038.
- The Climate Action Officer post has been made permanent.
- There is now a mandatory section on cabinet reports that asks for the author to consider the carbon and biodiversity impact of the decision.
Progress on changes to council buildings
- We have been awarded funding from the Heat Network Delivery Unit (HNDU) to investigate the feasibility of installing a heat network in the town centre. This would allow us to decarbonise our assets in the town centre under one project.
- The Future Asset Plan project is underway, which involves us assessing which buildings we want to retain and which we will sell. Once this has been completed we can focus on decarbonising the buildings we are going to retain.
Energy use and generation reduction
- We continue to reduce energy use as demonstrated by the published figures.
- At the end of the financial year 23/24 the council had converted 70% of its streetlighting to light-emitting diodes (LEDs), which use much less energy.
- The total electricity generated by council operated renewables for 23/24 is 109,390 kwh, which has saved 22 tonnes of carbon. This is a 35% increase on the previous year.
Transport
- We have now completed updating our fleet, which includes 15 fully electric vans..
Conclusion
This GHG report demonstrates that the council has reduced its emissions by 70% since the base year of 2008/09 and has made another year-on-year reduction from 22/23 of 6%. Most of our emissions come from the energy used in buildings, including schools, with those emissions accounting for 67% of the total. The other significant sources are streetlights (11%) and transport (Council Vehicles 13% and Business Travel 4%).
The Greenhouse Gas Emissions data suggests that we are ahead of schedule for achieving carbon neutrality for our emissions by 2038. However, as suggested in the report, a lot of the reductions that have been achieved to date have been a result of reducing the size of our operations, combined with the progress achieved on decarbonisation of the grid. The welcome announcement from the government to commit to clean power by 2030, will aid us with our aims and ultimately will help to reduce all electrical related emissions to zero. For this to be possible, however, we must reduce demand as much as possible and increase the amount of renewable generation on our buildings and land.
We must focus on reducing emissions from our buildings by improving their fabric and moving away from fossil fuel heating. We also need to decarbonise our fleet by transitioning to zero emissions vehicles and to reduce emissions from business travel by encouraging staff to use active travel, public transport and zero emissions vehicles.