Introduction
This report outlines the sources of greenhouse gas (GHG) emissions relating to Bury Council’s estate and operations in 2022/23. As with last year’s report, the data for academies has been removed as they are no longer within the Council's control. This year an estimated measure for homeworking has been included for the first time to reflect the Council’s shift to agile working. With these changes the Council is showing a 68% reduction in emissions since the base year of 2008/09.
Bury Council have set an objective of being carbon-neutral by 2038, this is a boroughwide target and even though this report demonstrates good progress towards carbon neutrality for the Council’s operations, these only account for an estimated 1-2% of overall emissions. Therefore, the Council still has a considerable way to go to reach its 2038 target. To achieve this ambitious goal the Council has written a Climate Action Strategy and Action Plan that requires change from partners, community groups and residents.
How we measure carbon emissions
Accounting tool and emission factors
To collate the data for this report we used Local Partnerships ‘Greenhouse Gas Accounting Tool. This tool uses the latest version of greenhouse gas conversion factors for 2022 released by the Government.
What areas of activity are included?
We have attempted to include all areas of our operation, including council operated buildings such as council offices, schools, community, and leisure centres; council related travel, streetlighting and homeworking.
Base year
The base year is 2008/09.
Targets
Bury Council has declared a Climate Emergency and set a target for the borough to be carbon neutral by 2038. This includes all emissions associated with the operation of the council that are recorded in this report.
A Climate Strategy and Action plan were approved by cabinet in October 2021 and the latest update to the action plan was published earlier in March this year.
Types of emissions data
The Government has identified 3 types of emissions described as follows:
- Scope 1 - Emissions from activities that are owned or controlled by the council and are released straight into the atmosphere, for example, from council owned boilers and vehicles.
- Scope 2 - Emissions released due to using electricity.
- Scope 3 - Emissions from equipment or vehicles that do not belong to the council but are used to deliver council functions, for example, officers using their own cars for council business. It also includes the estimation for homeworking.
The Government recommends that the council report Scope 1 and 2 emissions, whereas the reporting of Scope 3 emissions is discretionary.
Scope 1
This report includes all Scope 1 emissions except for fugitive emissions. Fugitive emissions are uncontrolled emissions from air conditioning and refrigeration units. It was felt that this information would be difficult to collect accurately and would represent a small percentage of the Council’s total Scope 1 emissions.
Scope 2
All Scope 2 emissions have been included.
Scope 3
For Scope 3 emissions, the following have been included:
- Business mileage in private cars
- Outsourced travel relating to car parking enforcement.
- Business travel on planes, trains, and other public transport
- Losses in transmission of electricity (Government guidance advises that these emissions should appear in Scope 3)
- Home working
Bury Council’s Greenhouse Gas Reporting 2008/9 to 2022/23
| Emission | Base year 2008 / 09 | Last year 2021 / 22 | This year 2022 / 23 |
|---|---|---|---|
| Gas consumption (Scope 1) | 11313 | 5021 | 4133 |
| Owned equipment (Scope 1) | 255 | 94 | 16 |
| Owned transport (Scope 1) | 1499 | 1526 | 1163 |
| Total Scope 1 | 13067 | 6642 | 5312 |
| Purchased electricity (Scope 2) | 14560 | 3734 | 3189 |
| Total Scope 2 | 14560 | 3734 | 3189 |
| Business car travel (Scope 3) | 570 | 300 | 368 |
| Business rail travel (Scope 3) | 18 | 1 | 1 |
| Business air travel (Scope 3) | 10 | 2 | 1 |
| Electricity transmission and distribution losses (Scope 3) | 1132 | 330 | 292 |
| Homeworking (Scope 3) | n/a | n/a | 121 |
| Total Scope 3 | 1730 | 630 | 783 |
| Grand Total (Scope 1 to 3) | 29357 | 11007 | 9284 |
| Intensity measurement (t of CO2e per £m revenue expenditure) |
186 | 64 | 51 |
Carbon emission sources
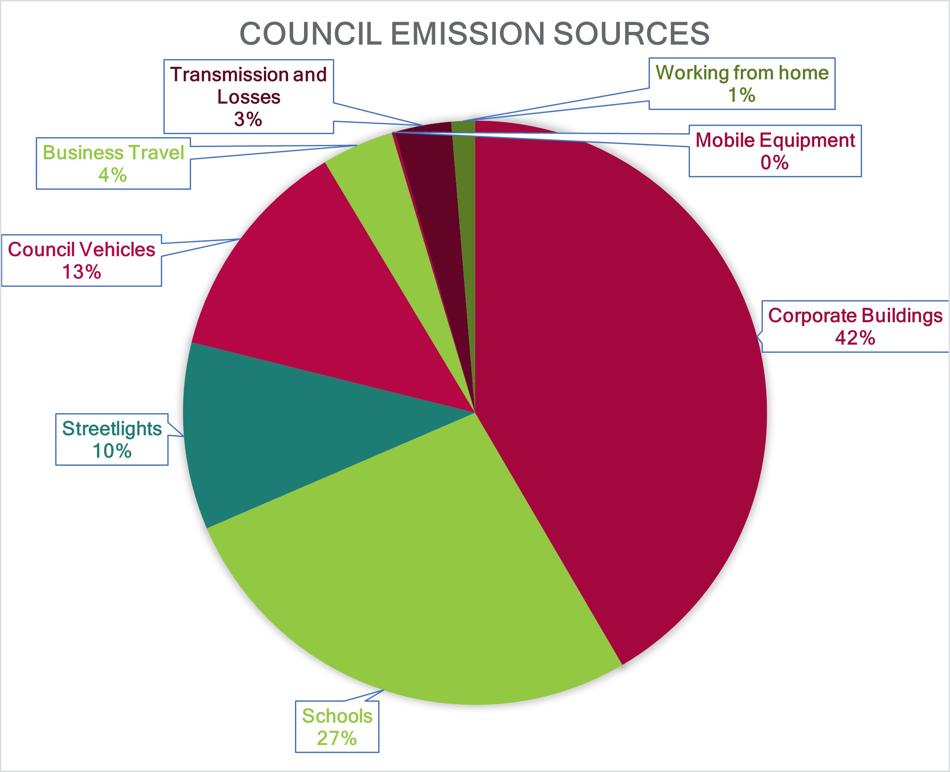
Council emission sources:
- Corporate buildings: 42%
- Schools: 27%
- Streetlights: 10%
- Council vehicles: 13%
- Business travel: 4%
- Mobile equipment: 0%
- Transmission and losses: 3%
- Working from home 1%
This information demonstrates where the council’s carbon emissions are coming from. It is clear to see that most of the emissions are coming from corporate buildings and schools, which makes up 69% of the total. The other significant sources are streetlights (10%) and transport (council vehicles 13% and business travel 4%).
Greenhouse gas emissions 2008/2009 to 2022/2023
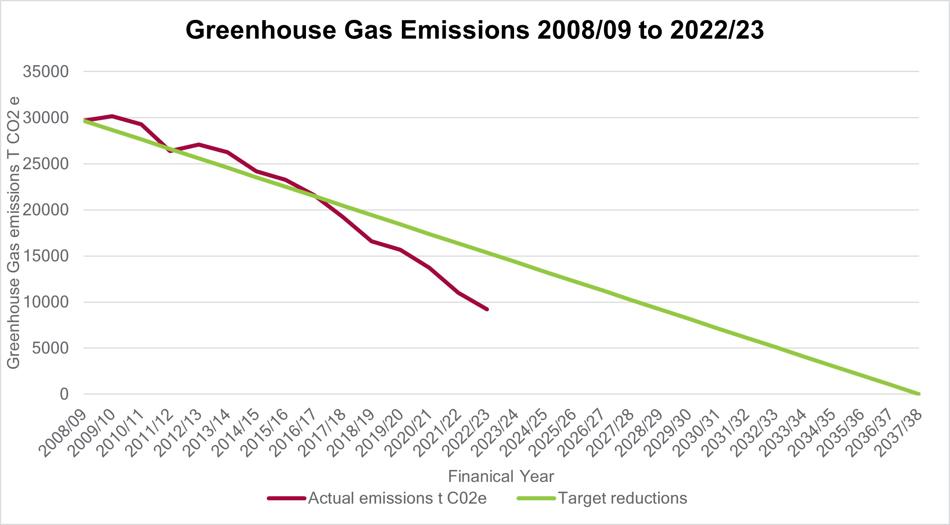
Progress on carbon reduction
The data and graphs show the progress Bury Council has made on reducing its own emissions year on year since the base year of 2008/09. The graph suggests that the council is well on track to achieve carbon neutrality for its own operational emissions by 2038. However, it should be noted that the council is now a lot smaller with less buildings and less staff since the baseline year of 2008/09. Schools changing to academies has also removed a lot of emissions from the council’s control. The council has recently updated its fleet of vehicles and carried out some building decarbonisation measures using Public Sector Decarbonisation Scheme funding. Alongside all this the council has benefitted from the decarbonisation of the electricity grid over the last 15 years.
Therefore, even though it appears the council is performing well at reducing its operational emissions, a lot of the reduction has come from reducing the size of the council and external influences with some progress from the council itself. There are very few easy measures left to reduce emissions and now significant efforts must be made to continue this progress and meet the target. This is especially important on the council’s corporate buildings and schools as this makes up most of the council’s emissions.
Electricity and gas use
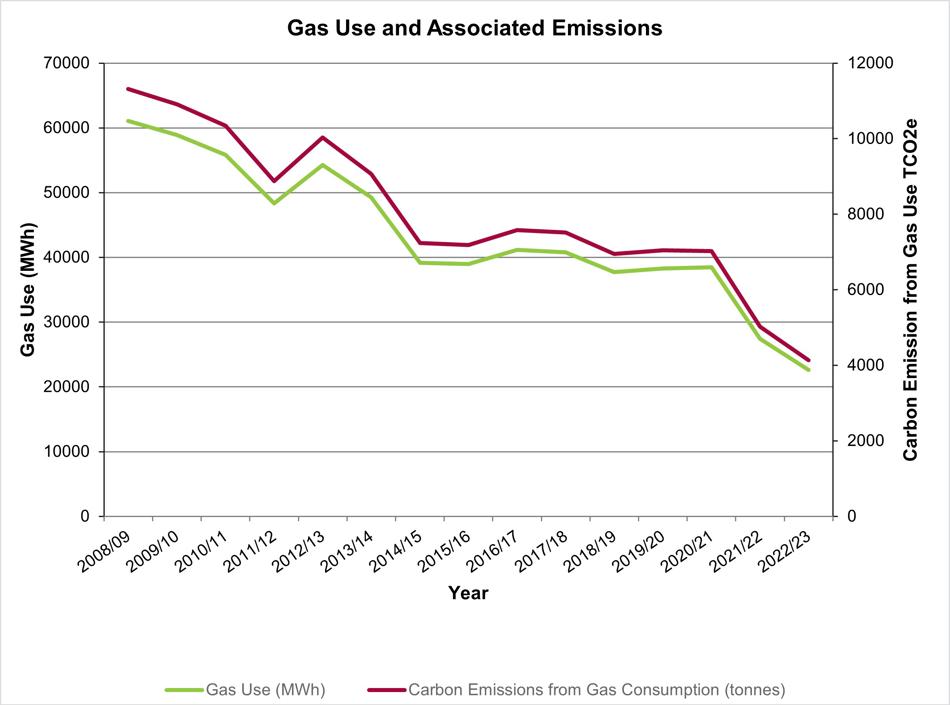
The graph shows emissions from gas use represent 45% of the council's total carbon emissions and these emissions have decreased 63% from the 2008/09 base year.
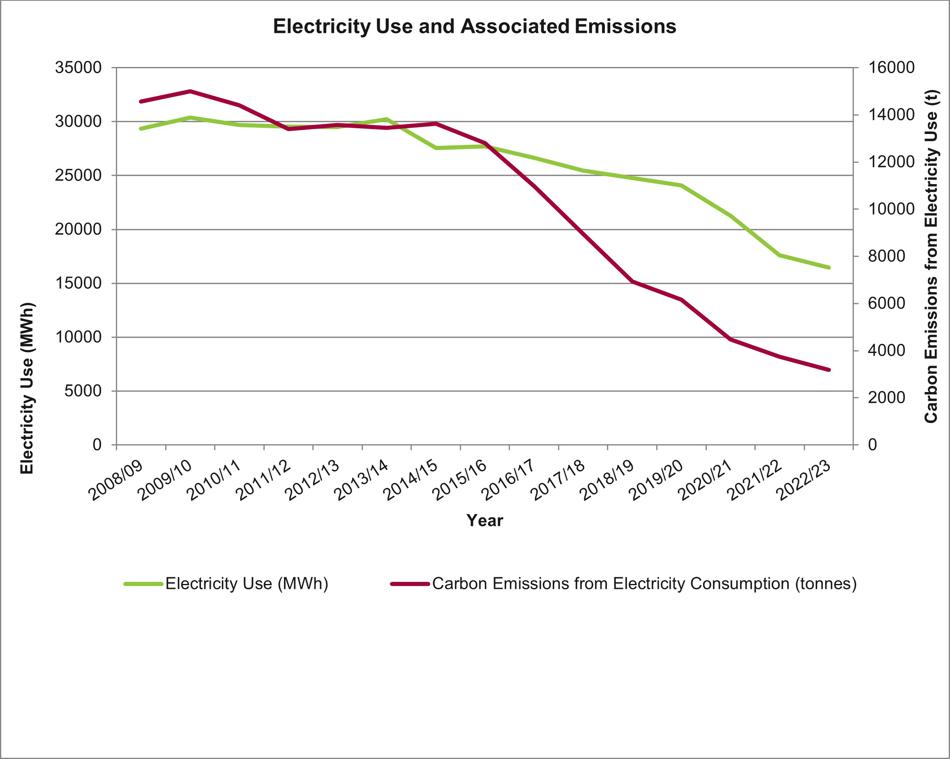
The graph shows that electricity use has decreased by 43% since our base year. However due to the decarbonisation of the grid the graph demonstrates a 78% reduction in carbon emissions from the council’s electricity consumption.
The graph also shows that electricity consumption represents 34% of the council’s emissions.
Council vehicles
In 2022/23 we saw emissions from council vehicles drop 24% from the previous year and be 22% lower than the base year. The £10 million investment in new vehicles including electric vans appears to have had a significant impact. Nearly all the fleet has been upgraded to Euro 6 diesel vehicles and 11 of the 15 ordered electric vans have been introduced.
The Council trialed Hydrotreated Vegetable Oil (HVO) as an alternative fuel which is said to have lower carbon emissions. However due to the uncertainty on the environmental credentials of the fuel and its extra cost the decision was taken to not continue with this fuel. HVO made up a small percentage (less than 1%) of the Council’s total fuel use.
Business travel
Business travel has increased since last year by 23% but is 35% down from the base year. This is most likely due to a return to normal working patterns after the pandemic, with more staff travelling for meetings and events.
Bury Council’s carbon management activity update
Climate Action team and Climate Action Strategy
- Bury Council has released its Climate Action Plan update, which gives an overview of the progress it has made towards its target of being carbon neutral by 2038.
- The posts of Climate Action Officer and Climate Action Intern have been extended until June 2024.
- There is now a mandatory climate change e-learning course for all staff to complete and over 50% of staff have already completed this.
Changes to council estate and agile working
- Council employees are now encouraged to attend the office for half of the working week, but the rest of the time are working in an agile way.
- The council has completed the decarbonisation measures on seven buildings using the Public Sector Decarbonisation Scheme funding. Unfortunately, due to the changes in the way this funding is now calculated the council has not been able to apply for any further funding.
- Working with the Greater Manchester Combined Authority (GMCA) the council has had decarbonisation feasibility studies carried out on five council assets.
- Working with the GMCA the council is awaiting feasibility studies on 22 council assets to assess their viability for solar PV installation.
- Bury has been successful with two £20 million Levelling Up fund bids, to support the development of a new civic hub in the heart of Radcliffe's town and a new market flexi hall, to strengthen Bury's town centre offer. We are integrating carbon neutrality into the development of both projects.
Energy use and generation reduction
- High energy costs continue to be an area of concern for the council.
- At the end of the financial year 22/23 the council has converted 62% if its streetlighting to light-emitting diodes LEDs.
- Total electricity generated from council operated renewables is 80,982 kwh, which has saved 15.6 tonnes of CO2.
Transport
- The council now has a corporate membership to a Car Club. The Car Club was installed as part of an E-Hub pilot project, with Manchester City Council and Transport for Greater Manchester. There are currently two car clubs, each with two electric vehicles available for short term hire at Market Car Park in Bury and Fairfax Road Car Park in Prestwich. With the corporate membership council officers can use these car clubs for business related journeys.
- The Council has been updating its fleet over the last 2 years. Due to this investment 77% of the fleet is now Euro 6 diesel or electric this includes 11 battery electric vans with 4 more still to be delivered.
Conclusion
This year’s report demonstrates that the council has reduced its carbon emissions by 68% compared to the base year and has made a significant reduction of 16% from 21/22. This is welcome progress but as stated above a lot of these improvements can be attributed to the reduction in the overall size of the Council and its operations as well as the decarbonisation of the grid. Further progress will require significant action from the council.
The data used in this report will be the first year since the COVID-19 pandemic that is likely to be unaffected by the measures that were introduced to manage the virus. However, the council is constantly adapting its report to respond to changes in council operations, for example as with last year we have removed academies as they are not in the council’s control and this year a figure for home working has also been included. The council aims to include more scope 3 emissions where possible and is always looking to improve its data gathering techniques.
As the council reduces its carbon emissions it will become harder and harder to find further reductions as the ‘easy’ measures and ‘quick wins’ will have all been achieved. To continue its progress the council will need to commit to significant actions. One of the biggest areas of action to work on is the Council’s corporate buildings and schools as these make up 69% of the council’s emissions. This will require work to rationalise the council’s estate, improving the energy efficiency of our buildings and moving away from fossil fuel based heating systems i.e., a gas boiler to low carbon alternatives i.e., heat pumps. The Council also needs to significantly increase the amount of renewable energy it generates on its assets as well as continue with the substantial progress that has been made with converting the streetlights to LEDs. The council needs to start planning how it will convert its fleet to zero emission vehicles in the future.
These annual greenhouse gas emissions reports demonstrate the progress the council is making towards reducing its own emissions and it is positive to see the downward trend as outlined in the greenhouse gas emissions graph above, but there is still much to do, and the council must continue make this a priority.